Technical Details
table of contents
If you’re new here, I’d recommend you start at the What Is WAR tab. If you have a solid grasp of the mathematics behind WAR, this page provides the nitty-gritty details that you may be interested in.
How WAR is Computed
WAR estimates are gathered from Baseball Reference, FanGraphs, and Baseball Prospectus.
Although the implementation details of each of these providers’ WAR formulas differ substantially, their structure is similar:
RAR = Batting_RAA + Fielding_RAA + Baserunning_RAA + Positional_Adjustment_RAA + Replacement_Level_Runs
WAR = RAR / RunsPerWin
Where RAA is runs above average and RAR is runs above replacement. For technical reasons described later on this page, throughout the site I present the sum of Positional RAA and Replacement Level Runs as one number, the positionally-aware Replacement Value. Beyond the technical reasons, I think this presentation is actually more intuitive to the public. It’s hard to wrap one’s head around the idea that a DH is worth -16 runs just by doing their job and being a DH. It’s much easier to conceptualize that their replacement value is only +8 runs, while a shortstop might be +30.
Data Sources
-
Baseball Reference provides WAR totals and components for every player-season in history at this handy link, updated daily: https://www.baseball-reference.com/data/war_daily_bat.txt. Usage note: for players who played on multiple teams in a year, those stints are broken out into separate rows, so you’ve got to combine them together.
-
FanGraphs leaderboards are available for export by members here. They also conveniently make an API publicly available. I use the following API endpoint to access all players with at least one plate appearance this season:
https://www.fangraphs.com/api/leaders/major-league/data?pos=all&stats=bat&lg=all&season=2024&month=0&season1=2024&qual=1&ind=0&pageitems=10000 -
Baseball Prospectus makes most of their WAR components publicly available to download in CSV format from their leaderboards page: https://www.baseballprospectus.com/leaderboards/. I use the following tabs: Hitting Summary, Hitting Deserved, Fielding Summary, Baserunning Summary.
A complete CSV file with all ~150 columns I use can be accessed here (around 1.5 MB). It is updated daily with the site.
Caveats, per Provider
Baseball Reference
Significant digits
Baseball Reference provides their underlying data at 0.1-run resolution, which is fine for most purposes, but for very small WAR totals it can lead to rounding errors in inferred values. For example…
Runs per win
Baseball Reference uses a variable runs-per-win, since a player’s own production can influence the run environment they play in. Fewer runs are needed to win when Randy Johnson is on the mound, because they’re harder to come by. They do not provide the value directly in their spreadsheet, so I estimate it by dividing RAR / WAR and RAA / WAA. For players where both WAA and WAR are close to zero, this can lead to some numerical instability, inflating or deflating the inferred runs-per-win value. But that issue only affects guys with very little value and playing time, and the absolute error is quite small.
Defense
Baseball Reference is more historically-oriented than the other two providers, meaning their WAR formulation is generally devised to be applicable and consistent across the decades of baseball history. As such, their defensive metrics are perhaps less advanced. I believe they use DRS, while FanGraphs uses Statcast OAA and BP uses a proprietary formula. In general, it’s still a good and reliable system. The exception is for catchers, since Baseball Reference does not include framing in their defensive stats.
GIDP
Baseball Reference includes grounded-into-double-play run value as a separate component, but I added it into baserunning value for consistency with FanGraphs, who do not separate GIDP from general baserunning.
FanGraphs
FanGraphs uses a constant runs-per-win for all players. I believe they use the same replacement level as Baseball Reference, but possibly different positional adjustments (not sure on that).
FanGraphs also provides a component of WAR called the “league adjustment”, which is just used to recenter each league’s RAA to zero. The adjustment is usually on the less than 2 runs per player. For consistency, I added this adjustment into the replacement level bucket.
Baseball Prospectus
Deserved stats
Of the three, Baseball Prospectus is most concerned with determining what a player “deserved”, as opposed to what actually happened. In general, they give more credit for statistically predictive and stable outcomes, like lots of home runs or a high walk rate, and less credit for “fluky” outcomes like triples and infield hits. In practice, this means they tend to be much more conservative in their WAR estimates for most players, especially speed-and-defense oriented guys.
As I understand it, their stats also (claim to) account for many more complicating factors than the other providers, such as the identity of the umpire for every plate appearance. I don’t know enough about their calculations to judge how well they do this or how big of an impact it has, but it is worth noting.
Runs per win
BP does not provide total runs above replacement or runs above average, so I cannot estimate runs per win with RAR / WAR or RAA / WAA. For simplicity, I use FanGraph’s runs-per-win value as a best estimate. RAR is then estimated with WAR * (FanGraphs runs per win).
Replacement level and positional adjustment
BP does not provide their replacement level or positional adjustment directly. But I can compute it with the following:
Replacement Level + Positional RAA = RAR - (Batting RAA + Fielding RAA + Baserunning RAA)
Notice that I can only compute the sum of replacement level and positional adjustment, and can’t tell how much each contributes to that sum. Because of that, throughout this site you will see “Replacement value”, which is actually this sum. I believe this is still a reasonable way to present this information, it’s just a positionally-aware replacement level.
Baseball Prospectus also seems to use a notably lower replacement level than the other two, which tilts value slightly more in favor of availability over exceptional production (think 2023 Marcus Semien vs 2023 Corey Seager). It is unclear to what degree their positional adjustments differ from the other two providers.
GIDP
I’m not sure whether BP considers GIDP to be a baserunning event, a hitting event, or both. It doesn’t affect the WAR totals, but the component breakdowns may be slightly off if we’re comparing e.g. FanGraphs baserunning with GIDP value to BP baserunning without GIDP value.
Permutation WAR
Permutation WAR is the only part of this site that doesn’t exist elsewhere (to my knowledge), so further explanation of it is warranted.
Assuming each provider’s estimate of each of the four components of WAR (batting, fielding, baserunning, replacement value) are independent—we’ll come back to this assumption—then there is no requirement that one provider’s batting value estimate be paired with that providers fielding value, or baserunning, or replacement level. Thus for a single player we can permute three versions of four components 3^4=81 different ways. To compare between players, we can analyze these permutations head-to-head to get 81 estimates of their value difference.
Note that it is tempting to compare every permutation of player A to every permutation of player B, resulting in 81x81=6561 comparisons, but I would argue that that is not valid. We should only compare like to like, since the relative scales of some providers’ metrics are different. For example, BP replacement levels are lower, so it would be unfair to directly compare to another WAR estimate which uses a different replacement level, since those are fundamentally different units.
Component Independence
Now, are the WAR components truly independent? Kind of. I’ve decided it’s close enough, but I wouldn’t take offense if you decided otherwise. I do believe that hitting, fielding, and baserunning are all close to perfectly independent, but the problem arises with positional adjustments. Positional adjustments are calibrated to capture the replacement-level offensive production at that position, and/or how much fielding value would be lost if you tried to fill that spot with an out-of-position player. That means positional adjustments are at least partly tied to how those providers estimate offensive and defensive value.
To investigate, I’ve plotted comparisons of replacement value (remember, that’s replacement level plus positional adjustment) below. All players with (1) at least 300 plate appearances through Sept 8 2024 and (2) a single primary position according to my FanGraphs data are included. That position data doesn’t split outfielders by position, so I only plotted catchers and infielders. I then prorated to 600 plate appearances. FanGraphs and BR agree quite well:
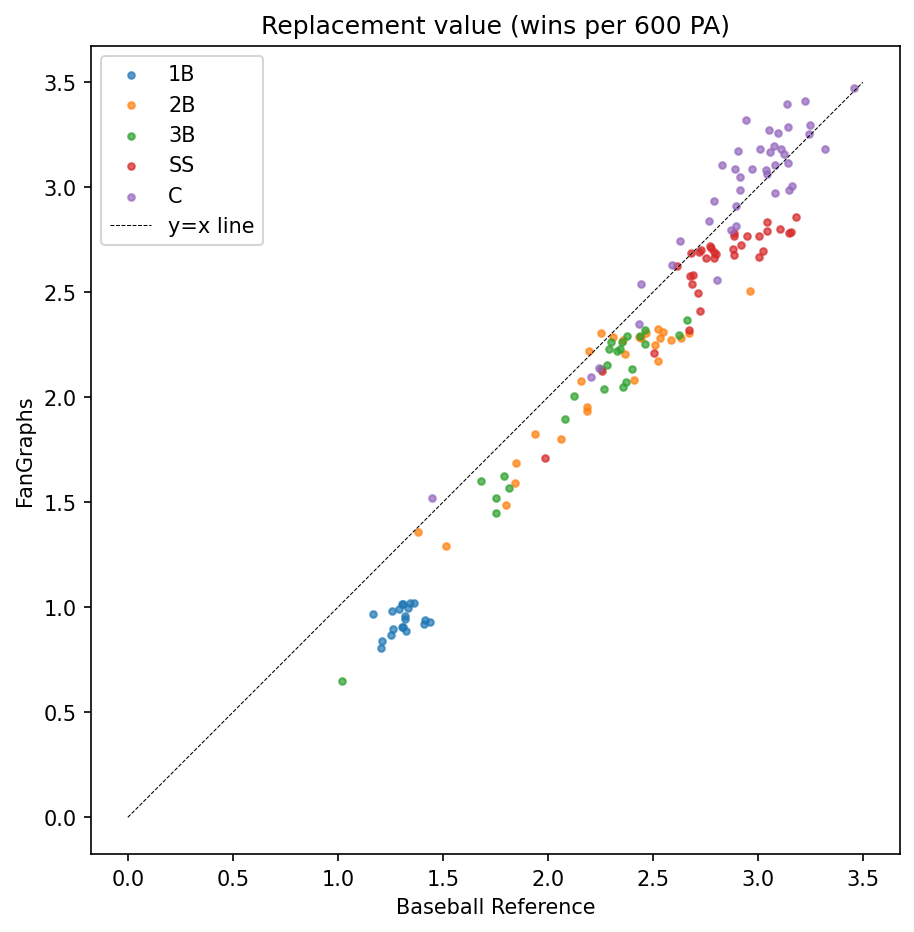
FanGraphs has perhaps a slightly larger spread between 1B and C, but it’s only about a quarter-win difference per 600 PAs. Comparing FanGraphs to BP on the other hand, we see BP has a notably more condensed scale:
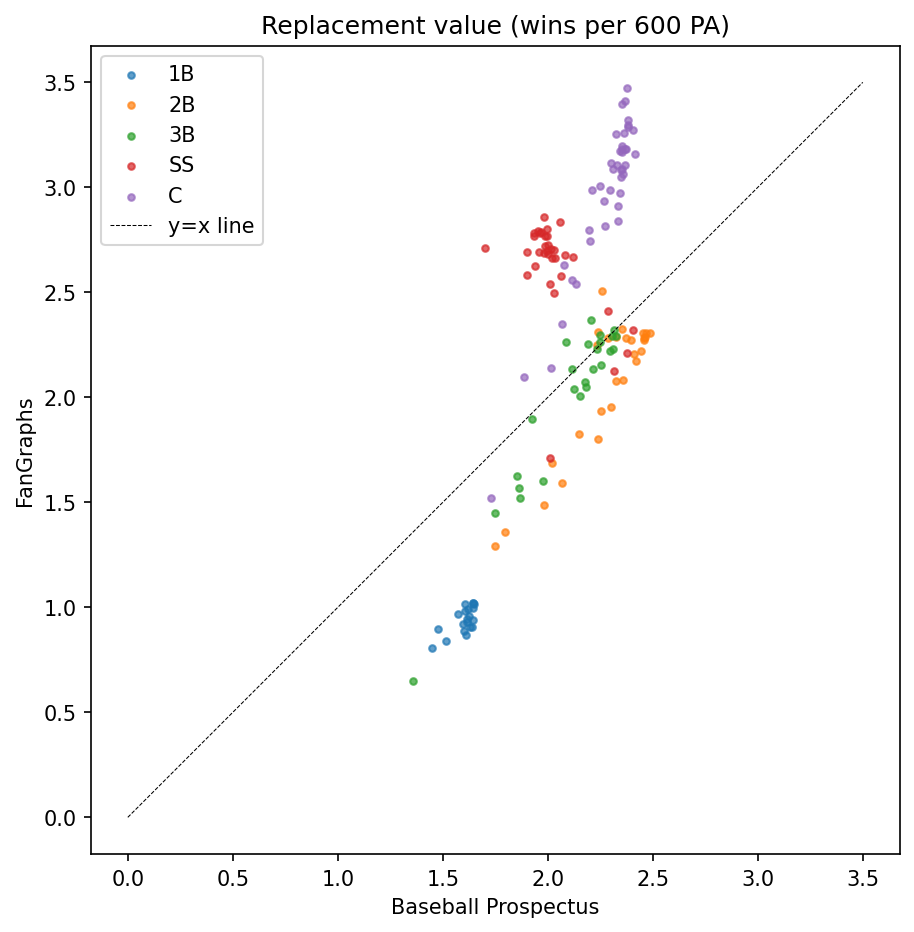
The difference between a 600 PA catcher vs 1B is only about 1 win according to BP (of course, I had to do some additional estimation to arrive at BPs numbers, including a borrowed runs-per-win factor as described above), while it’s closer to 2 or 2.5 for FanGraphs. This is reflective of the fact that BP’s batting and fielding value estimates are generally regressed toward the mean more, which compresses the difference between positions. At the same time, there is still a large spread within each position, and even disagreements about the ordering of positions (it seems BP ranks many 2B ahead of SS in positional value, which seems odd). I do believe that this inherent uncertainty in positional adjustments ends up dwarfing the possible error induced in permutation. Still, it might not be entirely mathematically sound to use Permutation WAR to compare players on opposite ends of the positional spectrum. If you have additional thoughts on this topic, feel free to reach out.
Production details
Stats are processed with Python, and plots are generated using Plotly.